Home · ESG
Verified by independent research

21.40 kg CO₂
per tonne.

Per tonne of food waste, digested on-site. Measured automatically at the machine — not estimated. Outperforms dehydrators by a factor of 16 and landfill by a factor of 138.

Independent research · University of Zagreb · 2022

Most desirable on-site
treatment after donation.

A 2022 study by the Faculty of Geotechnical Engineering ranked ten food-waste management methods by carbon footprint. Griffon’s aerobic digestion is identified as the most desirable on-site treatment after donation, with the lowest processing footprint of the devices tested. The research was not commissioned by Griffon; the device was selected by the academic team as a representative of the aerobic-digestion category.

What 21.40 kg per tonne means

A real-world example.

Croatian restaurants and catering establishments generated 15,072 tonnes of food waste in 2021. Sent to landfill without gas capture, that waste would have emitted between 28,637 and 43,709 tonnes of CO₂ equivalent — depending on the study used for the carbon factor.

Processed entirely by Griffon, the same volume would have emitted 318 tonnes of CO₂. That is the equivalent of taking between 6,170 and 9,418 passenger cars off the road for a year — or planting 473,000 to 723,000 tree seedlings growing for ten years.

Equivalence factors per US EPA Greenhouse Gas Equivalencies Calculator. Source: University of Zagreb, Faculty of Geotechnical Engineering, 2022.

Measured at the source

Every kilogram.
Logged automatically.

01
Built-in scales

Every kilogram is weighed automatically at the point of input. No manual data entry. No hauler estimates. The scale is the data source — primary data per the CSRD definition.

02
Automatic logging

Daily, monthly and annual food-waste mass logs, exported on demand (CSV, PDF, JSON). This measured mass is the primary data your ESG figures are calculated from — the machine does not estimate or self-certify.

03
CO₂ tracking from primary data

Transport trips eliminated, tonnes diverted from landfill, CO₂ avoided — all derived from primary data using the carbon factors validated by the 2022 University of Zagreb research.

04
Reporting-ready data

Structured mass data your ESG team converts into Scope 1 and Scope 3 disclosures and food-waste reduction reporting — primary-data evidence, not estimates.

CSRD context

Why primary data matters now.

For organisations that report under the EU Corporate Sustainability Reporting Directive, estimates and industry averages no longer satisfy auditors. They require primary data — weighed, time-stamped and traceable to the source.

Griffon is positioned as an audit-grade primary data source for Scope 1 and Scope 3 emissions tied to food-waste handling. Each kilogram contributes a documented data point to your sustainability statement. Following the 2025 Omnibus simplification, mandatory CSRD reporting now applies to larger groups (over 1,000 employees and €450M turnover); for every other operator, the same primary data supports voluntary ESG reporting and the EU’s binding 2030 food-waste reduction targets.

Sample statement · anonymised data of a real site · 1 Jul – 22 Sep 2026

This is what
your audit team gets.

Built from the machine’s measured mass data: a Food Waste Data Statement structured to GRI 306 (306-3 / 306-4 / 306-5), ESRS E5-5 under CSRD and the HWMM / HCMI hospitality indicators. Scope and boundaries, data source and quality, monthly table, avoided emissions per the University of Zagreb 2022 study with stated limitations, ready-to-use wording for your report and a signature block. Two A4 pages.

36.2t
Food waste generated & treated
100%
Diversion rate from disposal
26.7t CO₂e
Net CO₂e avoided
431kg
Average per day
84 / 84
Days with data
0.95kg
Per guest-night (illustrative)
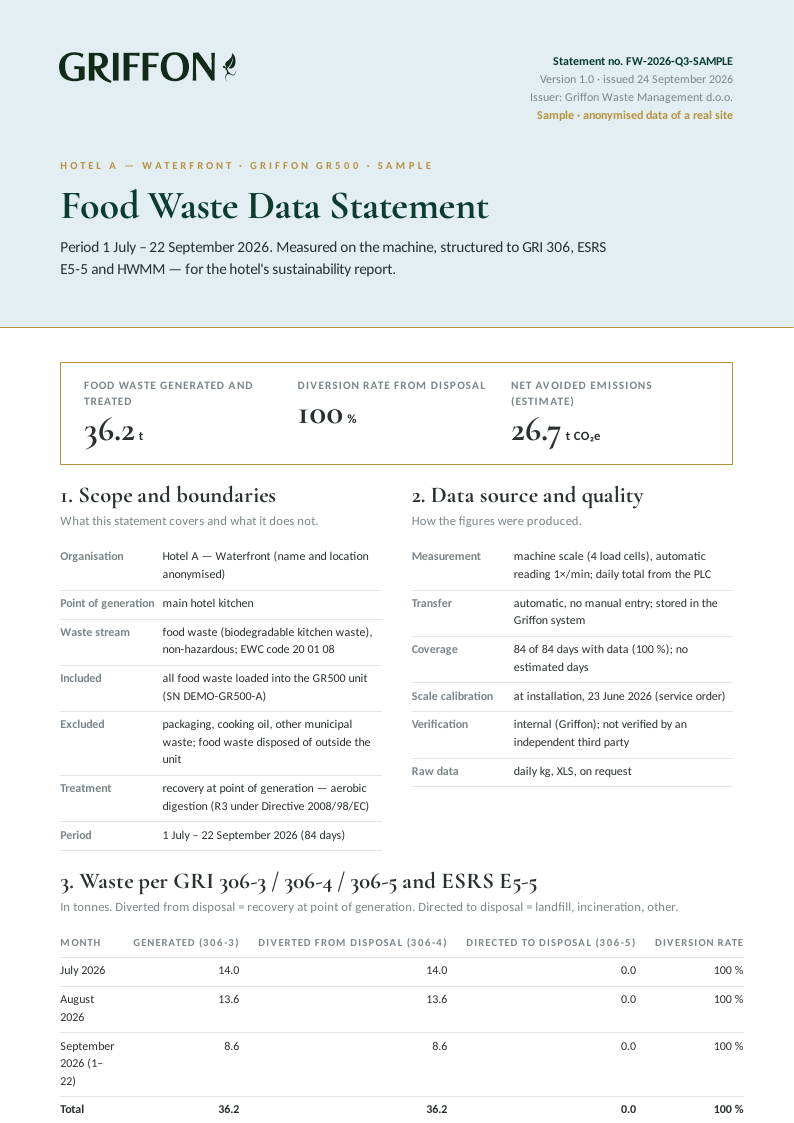
Griffon Insight sample food waste data statement, page 1
What’s inside the statement

Six sections.
One source of truth.

01
Scope and boundaries

Organisation, point of generation, waste stream (food waste, EWC 20 01 08), what is included and what is not, treatment method (recovery at point of generation, R3) and period.

02
Data source and quality

Machine scale with four load cells, automatic reading once a minute, daily totals from the PLC, no manual entry. Coverage in days, calibration date, verification status, raw data on request.

03
Waste per GRI 306 and ESRS E5-5

Monthly table in tonnes: generated (306-3), diverted from disposal (306-4), directed to disposal (306-5) and the diversion rate — the lines your CSRD report asks for.

04
Hospitality indicators · HWMM / HCMI

Total in period, average per day, food waste per guest-night and per m², diversion rate — normalised values comparable across properties and years.

05
Greenhouse gas emissions

Avoided emissions per the University of Zagreb 2022 study: 791 kg CO₂e/t for landfill with gas capture, plus transport, minus the unit’s electricity and process — net 737.6 kg/t, with the limitations stated.

06
Wording and confirmation

Ready-to-use sentences for the hotel’s report, citing the statement as source, and the issuer’s confirmation that the data were read automatically from the machine and not altered by hand.

Every gram, logged.

No spreadsheets. No estimates. Primary data, captured at the machine, ready for audit. Full sample ESG report and the University of Zagreb research available on request.

Specify your model ROI